Summertime is prime time for national parks. As snow melts, wildflowers bloom, and waterfalls roar, generations of visitors have flocked to the natural wonders that dot the American landscape (to say nothing of all the amazing cultural sites the National Park Service protects).
The National Park Service was created a century ago — Aug. 25, 1916, to be exact — to keep an eye on the growing treasure trove of national parks. It’s been a good century as more and more land has been set aside and annual visitors now number more than 300 million, but it’s also not been without challenges. Chief among them is climate change, which will drastically alter national park landscapes in the coming decades including cranking up the heat.
As part of Climate Central’s ongoing States at Risk project, we analyzed just how much hotter parks are projected to get later this century. We looked at the future summer temperatures in all the parks in the Lower 48 states except Dry Tortugas National Park (sorry, Fort Jefferson lovers!) assuming greenhouse gas emissions continue on their current trend. To put it in clearer context, we mapped out what places today are most comparable to park’s climates of tomorrow.
[protected-iframe id=”41173808a02925b13310a49f49f5306b-5104299-15574887″ info=”https://www.climatecentral.org/wgts/2016ShiftingParks/index.html?utm_source=cc&utm_medium=embed&utm_campaign=2016ShiftingParks” width=”660″ height=”660″ frameborder=”0″ scrolling=”no”]
The results could make you sweat. Parks are projected to have summers that are 8 to 12 degrees F hotter by 2100. That means currently cool mountainous parks could be as hot as the plains. Parks in the Southeast, already a pretty hot place, will face even more extreme temperatures with a climate more like southern Texas. And otherworldly Joshua Tree National Park in southern California will face the greatest geographical climate shift, with temperatures more like Abu Dhabi by 2100.
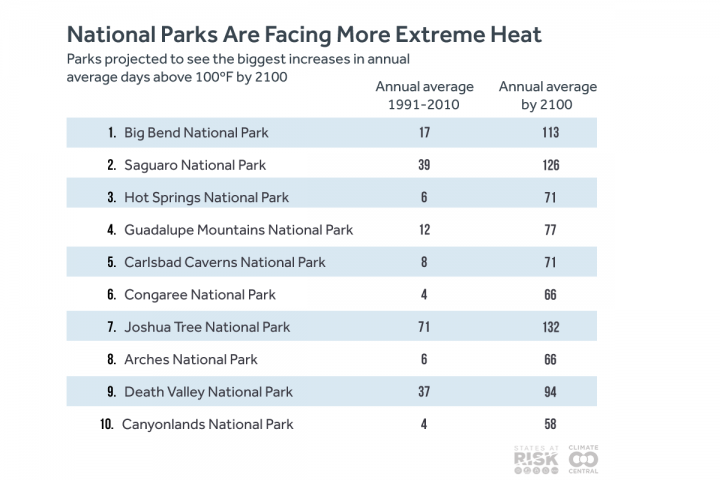
We also analyzed how many more days with extreme heat the parks could face. Extreme heat is a hallmark of global warming, and its impact will be most arresting in the national parks where people go, by design, to be outside in the summer. Like the rest of the country, parks are going to be seeing more dangerously hot days above 90 degrees F, 95 degrees F, and 100 degrees F.
By 2100, the glaciers of Montana’s Glacier National Park will be long gone and rising temperatures will be one of the big reasons why. Visitors will not only have to contend with an ice-free landscape, but also hotter temperatures. Today the park sees an average of only one 90 degrees F day each year. It could see 27 days with temperatures above 90 degrees F by the end of the century.

Yosemite National Park, high in the Sierra Nevada mountains of California, currently sees about two weeks of 90 degrees F weather every year. By 2050, it could see nearly a month of those temperatures, and by 2100 it could get nearly 50 such days each year.
And the Great Smoky Mountains, currently the most visited National Park, could go from fewer than 10 days above 90 degrees F each year, on average now, to three months with those scorching temperatures.
In numerous other parks, the number of days above 100 degrees F is projected to skyrocket. Big Bend National Park in Texas could see more than 110 days above 100 degrees F each year, on average. And Great Basin National Park in Nevada, which currently doesn’t have any days above 100 degrees F in a typical year, could see a month of those temperatures each year by 2100.
It’s likely that parks on the more extreme end of the temperature scale will see a drop in summer visitation, but more visitors are likely to show up in fall and spring when it won’t be fry-an-egg-on-the-sidewalk hot. That may stretch park resources thin as most parks are set up to handle summer crowds and quieter shoulder seasons. How parks will deal with the change in visitation season is an open question.
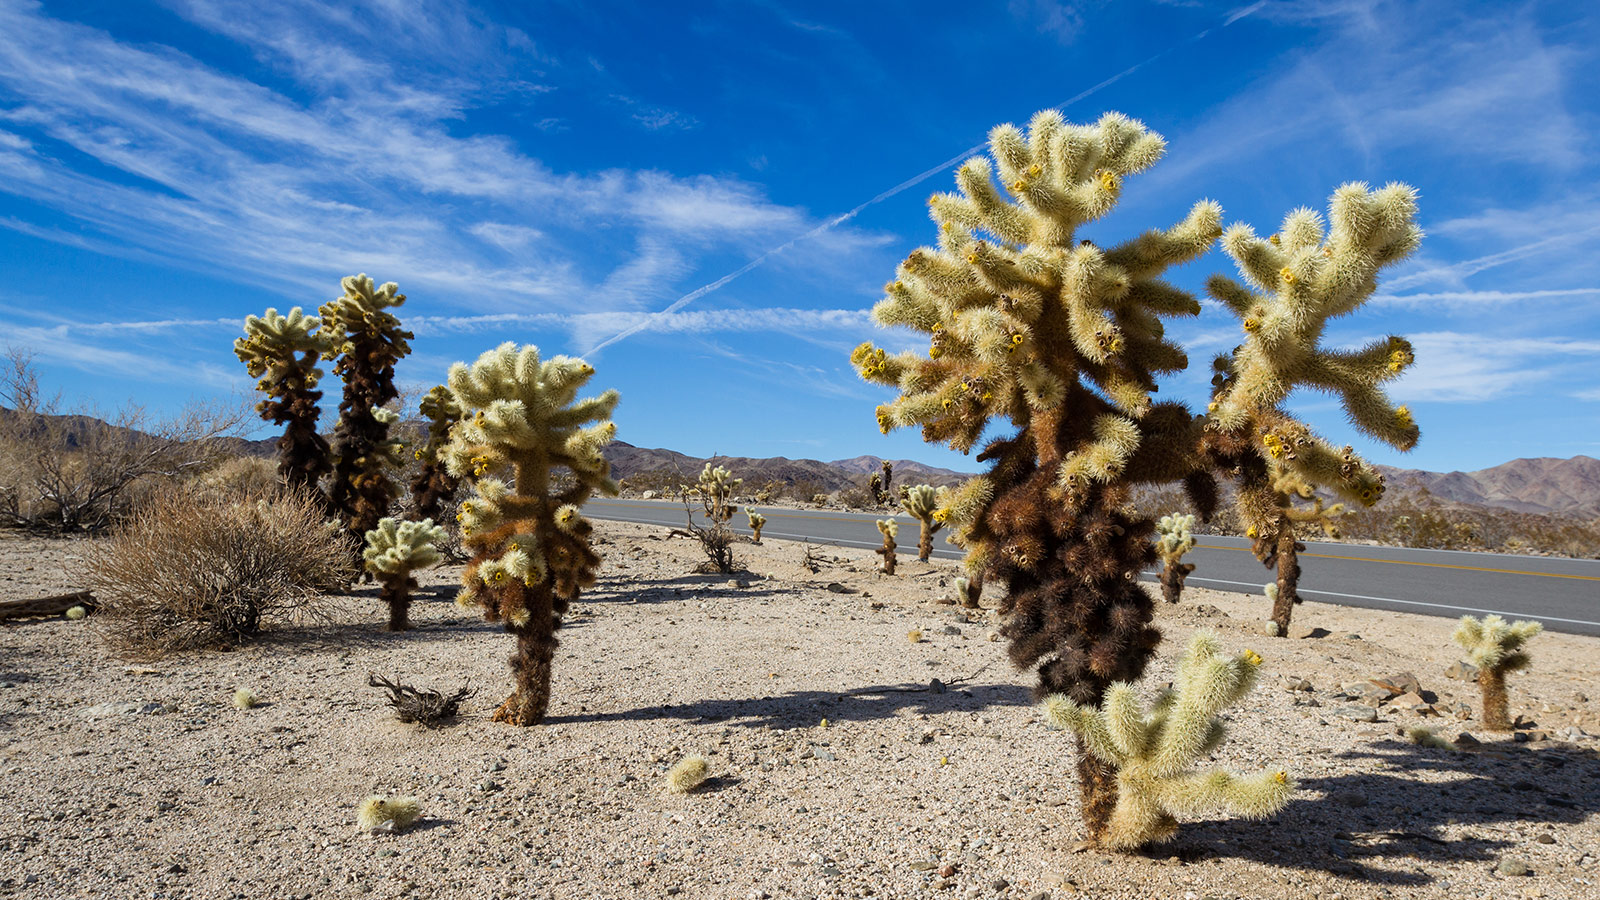
And all this is to say nothing about the impacts extreme heat will have on the natural resources around which we created national parks in the first place. Joshua Tree could become too hot for its namesake trees, and there’s evidence that extreme summer days could create more rockfalls in Yosemite, which could change the face of the stunning valley at the center of the park. Wildfire risk will also skyrocket across the West and could make summer park vacations not only more hot but more smoky.
Those are just the most visible changes. Whole ecosystems are likely to be disrupted and there are consequences scientists probably haven’t even uncovered yet (those are the ones that could be the worst since we’ll be least prepared).
Despite the daunting situation facing the National Park Service in its second century, there are signs it’s up for the challenge. It’s already addressing climate change from the coast to the high mountains and has an A-Team team of experts to help parks answer the gnarly questions they face.
There’s no denying that national parks will look a lot different by the end of the century, but that won’t make them any less a part of the fabric of American identity.
Analysis by James Bronzan and Alyson Kenward, PhD.
Methodology: Future temperatures for 47 National Parks were calculated based on the median of 29 spatially downscaled climate models (CMIP5) at 1/8 degree scale, then averaged within park boundaries. National parks in Alaska and Hawaii, along with Dry Tortugas National Park, were excluded because projections at this resolution were unavailable. Temperatures for 2050 are based on the 20-year average of 2041-2060 and for 2100 are based on the period 2080-2099. Projected temperatures assume that greenhouse gas emissions continue at their current rate (RCP8.5). The interactive map features the average summer daily high temperature (June-August), while days over 90oF, 95oF, and 100oF were counted annually. The current period values for parks and climate divisions are based on the 1991-2010 average calculated using a gridded observational dataset by Ed Maurer of Santa Clara University.


