This story is reproduced here as part of the Climate Desk collaboration.
When you read headlines about how Congress is rife with climate change deniers and willing to vote in favor of a massive oil pipeline that could increase greenhouse gas emissions, it’s easy to get discouraged about the direction the U.S. is headed on global warming. But when you look at some of the hard numbers about how Americans are getting their energy, there’s actually a lot to be excited about.
This morning, Bloomberg New Energy Finance released a fat report on the state of U.S. energy, and it’s chock-full of kickass facts and figures that reveal real, tangible progress on reversing the habits that cause climate change. Here are just a few of the most salient bits:
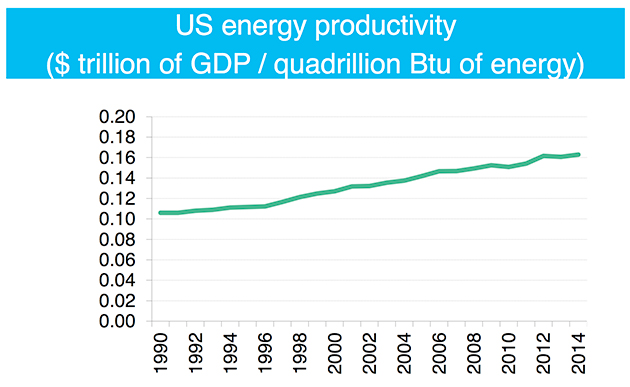
The U.S. is getting way more efficient. It used to be that electricity demand rose and fell roughly in line with economic productivity. That’s no longer the case: Thanks to massive gains in energy efficiency in everything from home appliances to factory lines, energy demand is now less tied to economic growth than ever before. In fact, since 2007, electricity demand hasn’t grown at all, the report finds. Zero. Another way to say that is that the U.S. is becoming more “energy productive,” meaning the U.S. is using fewer units of energy for every unit of GDP. Energy productivity has increased 54 percent since 1990:
BNEF
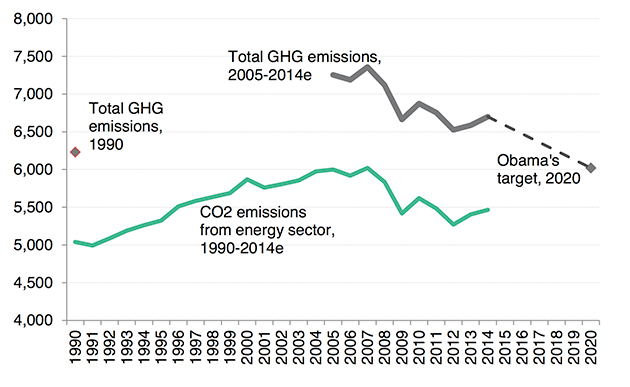
Since energy makes up about 83 percent of America’s total carbon footprint, those gains in efficiency (along with big shakeups in where our energy comes from, which I’ll get to shortly) have helped drive total carbon emissions down 9.2 percent from their 2007 all-time peak:
BNEF
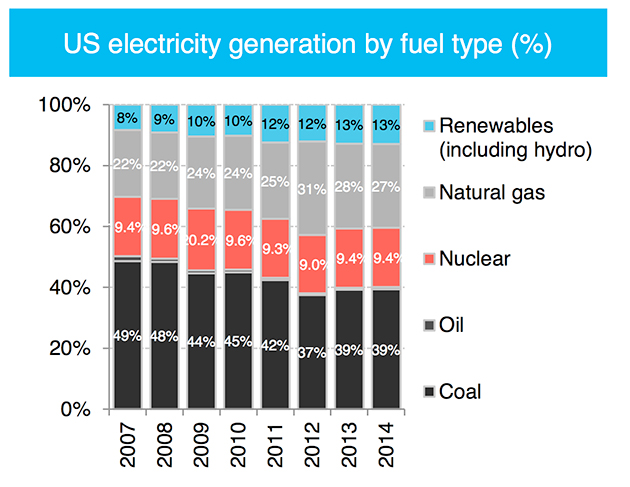
Coal is getting the boot. Coal used to provide half or more of the country’s electricity. Now, that number is down to 39 percent, thanks largely to increasing reliance on natural gas made plentiful and cheap by the fracking boom. Both production and consumption of natural gas were at all-time highs in 2014:
BNEF
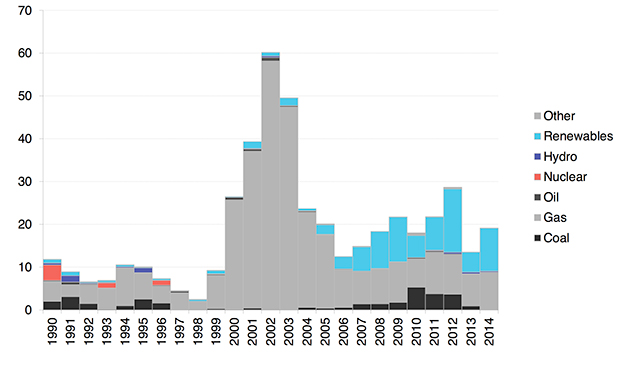
Renewable energy is blowing up. Natural gas isn’t the only big winner: Renewables are skyrocketing too. Solar and wind production have more than tripled since 2008. The share of all renewable energy sources combined (including large hydropower dams) in the U.S. energy mix has nearly doubled since 2008, from 8 percent to 13 percent. This chart shows how much new capacity of each energy source was added in each year; the gray is natural gas and the light blue is renewables:
BNEF
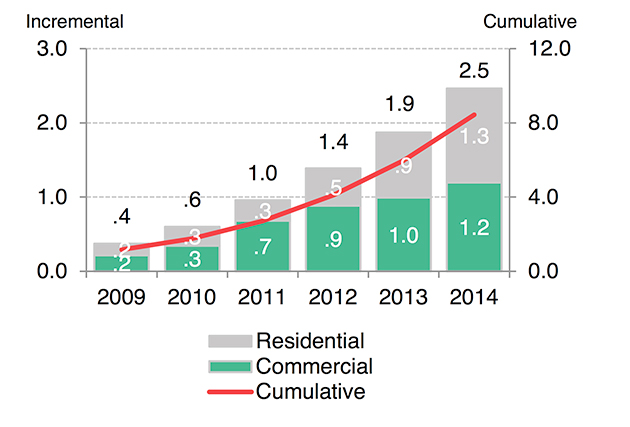
As we’ve reported before, solar is going gangbusters; the bars below show how much rooftop solar was added each year, and the red line represents the cumulative total:
BNEF
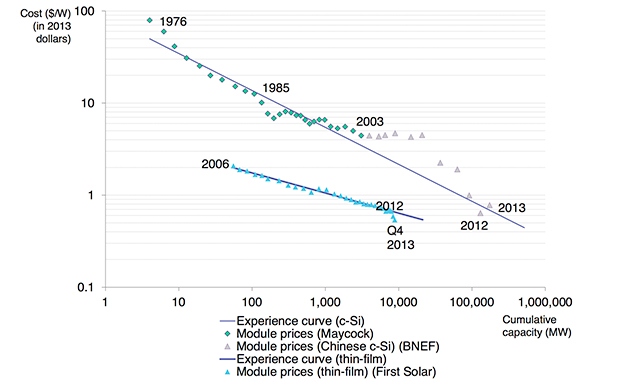
Behind that trend is an ongoing freefall in the cost of solar panels. This chart shows how the more solar that gets installed, the cheaper each unit of it becomes, thanks to technology improvements and breakneck production at Chinese factories. The two lines are for different types of modules, but the important thing is that they’re both headed downhill:
BNEF
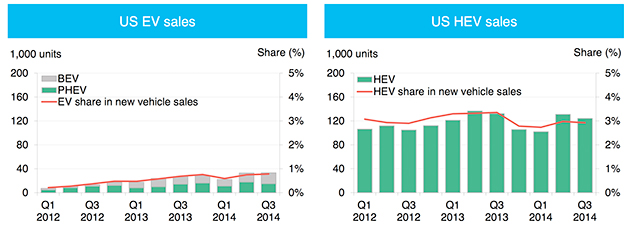
Cars are cleaner, and we’re using them less. Gasoline consumption is down 8.6 percent from 2005, which the report attributes to “increasing vehicle efficiency prompted by federal policy, increasing consumer preference for less thirsty vehicles, changing driving patterns (declining number of vehicles on the road, declining miles per vehicle), and increasing biofuel blending.” The relative climate benefits of biofuels are still being hotly debated, but the rest of those trends are pretty objectively awesome. The trend for electric vehicles is less impressive. Although the number of public electric vehicle charging stations has exploded 470 percent since 2011, sales are pretty ho-hum. The report blames low oil prices:
BNEF

