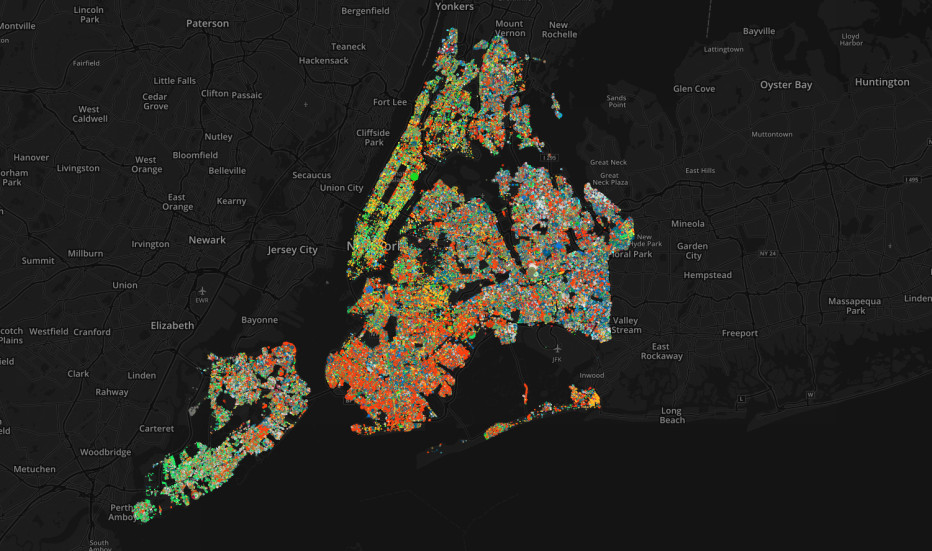
New York City’s five boroughs are famous for their unique personalities. Less known is the fact that each borough has a totally unique range of tree species, too! A new interactive map, created by Brooklyn-based web developer Jill Hubley, pinpoints the location of each of the city’s 592,130 street trees, representing 52 species, with information from the NYC Parks and Recreation Department’s 2005 tree census.
The map is both hypnotizing and educational. You can play around with its two different functions: identifying particular species, or viewing the distribution of all species across the city. Here’s more from Hubley on what you’ll be seeing, you know, other than a mesmerizing kaleidoscope of color:
The map makes clear the most prevalent trees in each borough, while simultaneously revealing clusters of diverse species. Tree selection varies per site based on site condition, overhead clearance and tree bed width. The Parks Department uses these criteria to define the habitat for each planting area, which in turn determines the range of species that can be planted.
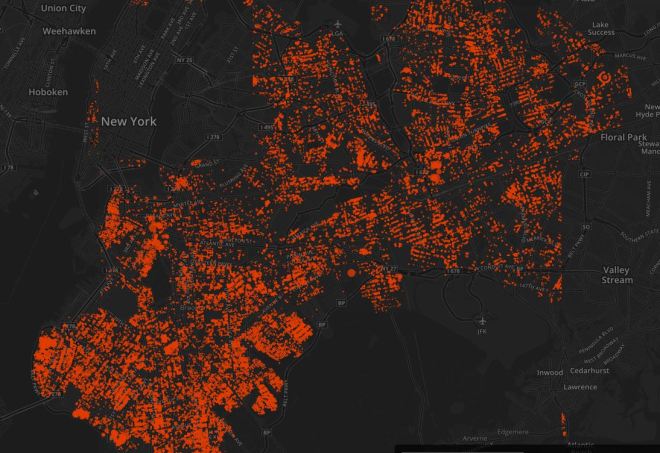
You’ll notice more red than any other hue — that’s the London Plane, the most populous species in the city (and, might we add, former city parks chief Adrian Benepe’s personal fave).

The red dots represent London Plane trees, New York’s most populous species.Jill Hubley
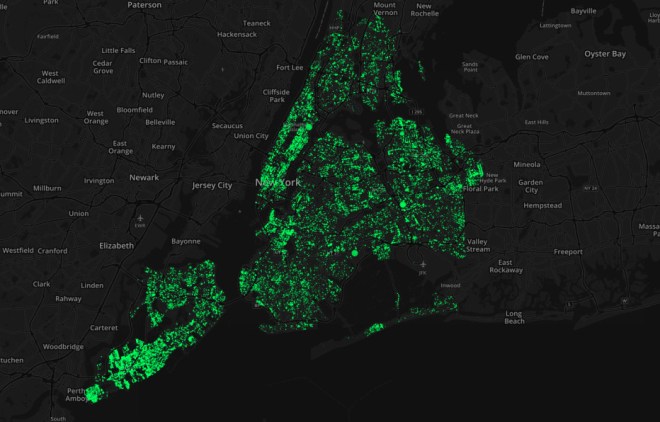
The Bronx is dense with maroon, northern red oak. Queens is dotted in turquoise, Japanese maple. And in Manhattan and Staten Island, you’ll see more green, or Callery Pears, an invasive species from China with a pretty noxious scent:

Lime green represents Callery Pear, an invasive species from China known for its putrid scent.Jill Hubley
As Wired’s Neel V. Patel points out, the map highlights a troubling pattern about New York’s tree biodiversity in 2005:
Traditionally, the Parks Department has worked to avoid floral monocultures—homogenous plant populations—by shaking things up and growing nonnatives throughout the city. But if those species aren’t chosen very carefully, they can have a potentially harmful and even dangerous impact on the surrounding area.
For example, Callery pears, an invasive species from China, are all over the region, particularly in Staten Island. Besides bearing responsibility for a repulsive smell (many people think Callery pears give off an aroma reminiscent of rotting fish, chlorine, or semen—so it more-or-less fits in with NYC’s odor profile), the tree is susceptible to losing limbs or keeling over during strong winds, heavy snowfall or ice storms. In other words, it makes no sense to have it present in such large numbers throughout New York City, especially after Hurricane Sandy.
Plus, many trees do more for beautifying the neighborhood than stabilizing the ecosystem, as non-native tree species often don’t provide food or habitat for native birds.
That could change, however — and might be changing already. Since the last census was conducted, the city launched a plan to plant 1 million new trees by the end of 2015, as I’ve written before. The planting is in part due to a project called Million Trees NYC, a 10-year campaign led by the parks department and Bette Midler’s New York Restoration Project. An unbeleafably good idea (sorry), seeing as urban trees have been linked to crime reduction and cooling down urban heat island effect.
When the map is updated after the next tree census — which starts this summer, with results expected in the fall of 2016 — the dots will undoubtedly become denser and more diverse.
And you’ll find releaf (last one!) in this: The Parks Department will use the census data, along with Hubley’s visualizations, to learn how to make better planting decisions in the future — hopefully, favoring life-giving, native species over invasives that smell like rotting fish.


