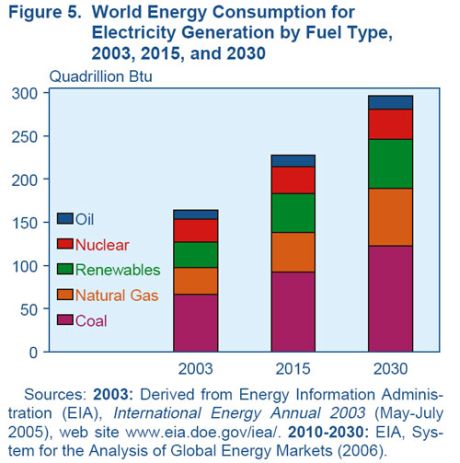
The graph under the fold is taken from the Energy Information Administration’s International Energy Outlook 2006. Read it and weep.
The graph under the fold is taken from the Energy Information Administration’s International Energy Outlook 2006. Read it and weep.
