Dear Umbra,
Are there any statistics that show what percentage of solar power is generated state by state, and which states are more solar-friendly? Also, do power companies give out any figures on how much energy they buy back from home solar producers?
Thanks from Los Angeles, Calif.
Dearest Los Angeles,
Life is great. As your researcher, I get paid to find previously obscure (to me) gems like today’s favorite website: the Energy Information Administration, an entire government agency dedicated to answering your question. Isn’t that just so 1977?

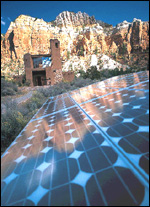
Not made in the shade.
Photo: National Renewable
Energy Laboratory.
I hunted around a bit and I think you’ll be able to get pretty far with this website. It contains charts, tables, graphs, and maps that record, compare, and contrast all sorts of energy information. Narratives for each state describe the renewables incentives therein. Apparently the site once had national maps of solar power plants, but they have been removed for security reasons; now there are fun energy-potential maps instead (like this one) that show the resources waiting to be harvested.
A little background for the general readership on the second half of your query: Homeowners who install solar panels and connect them to the utility grid are often able to “sell” excess electricity back to their utility. (“Selling” is actually something of a misnomer, as no money typically changes hands; read on to understand why not.) If Comrade Ivanoff’s home solar system meets all of his power needs and then some, the extra flows back into the city electric pool. That’s how it works in Washington state, at any rate (ha ha). This is known as “net metering” because the meter itself will show the net difference between electricity used and electricity generated at the home. Let’s say Ivanoff’s solar system produces more energy than he uses during summer days. His meter will actually run backward as his electricity feeds into the grid. At night, however, he’s in the habit of taking multiple hot baths and leaving the refrigerator open, so the meter will run forward again. A typical meter reader sees only the net use. It is unlikely that the utility would actually pay Comrade Ivanoff if he generates more than he uses over the course of a year, although this depends upon the utility. In Washington, residents can arrange net metering for solar, micro hydro, fuel cells, and wind-power generators of 25 kilowatts or less.
Unless a utility intentionally tracks customer electricity generation via special electric meters installed at each home, it will have only an educated guess as to the number of kilowatt-hours of energy brought in through net metering. A one-kilowatt system should generate about 1,200 kWh per year in Seattle. If Seattle has three net-metering arrangements (which the friendly Seattle Utility Guy suggested was the case), some simple math will get you your number.
You don’t say why you wish to find this information, but if your question eventually becomes focused on a particular region of the country, a few phone calls to local utilities should give you ballpark figures.
Voltaically,
Umbra


