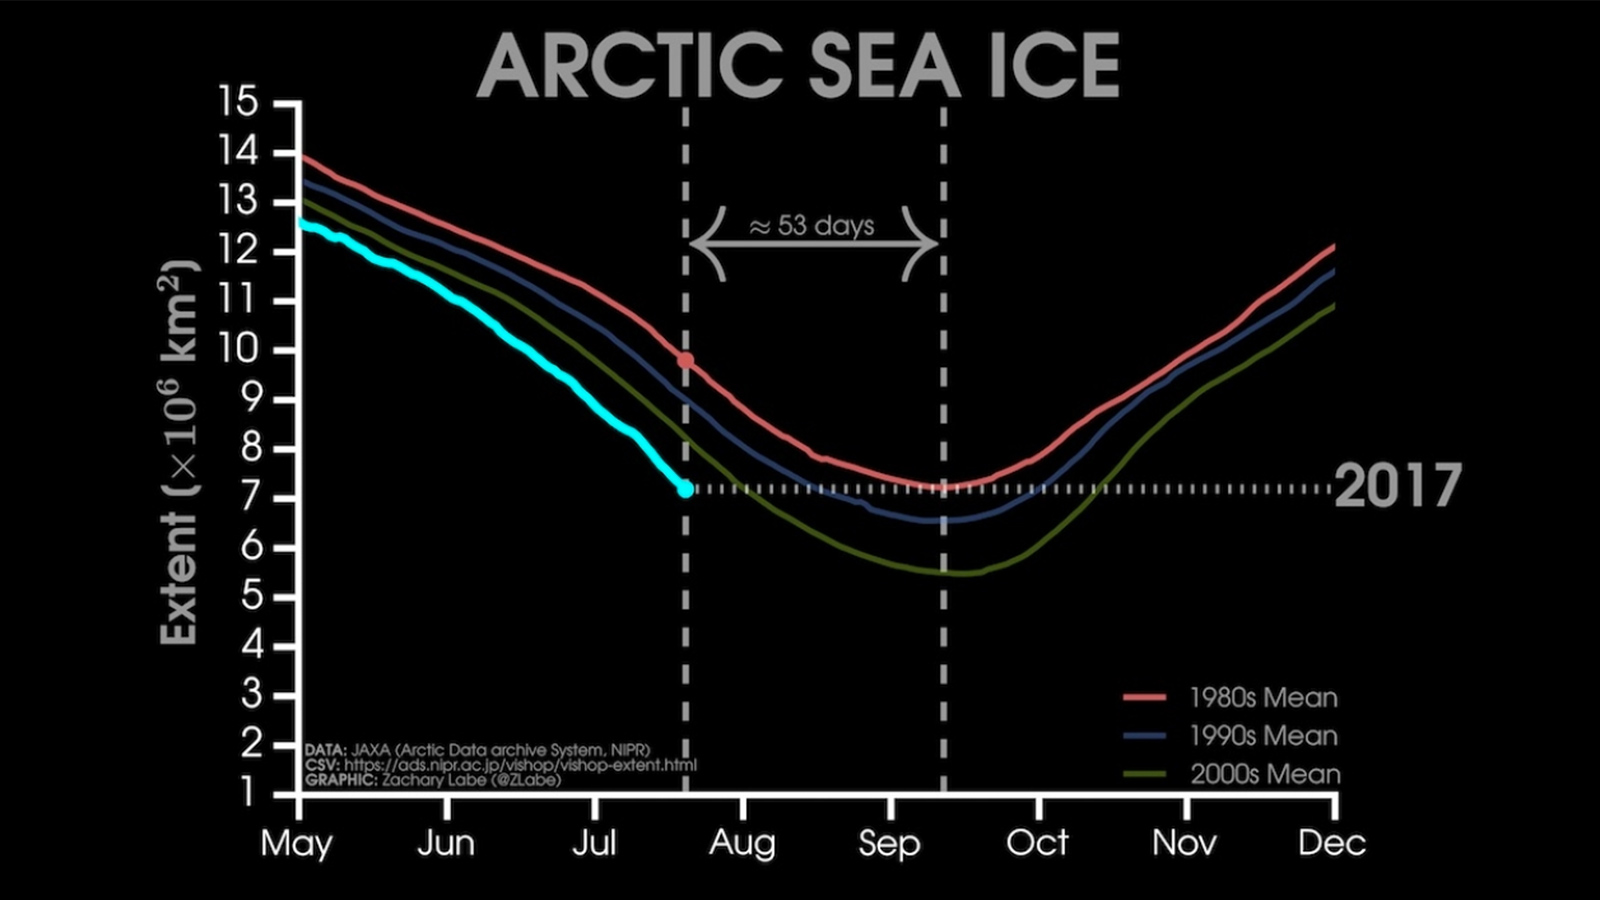
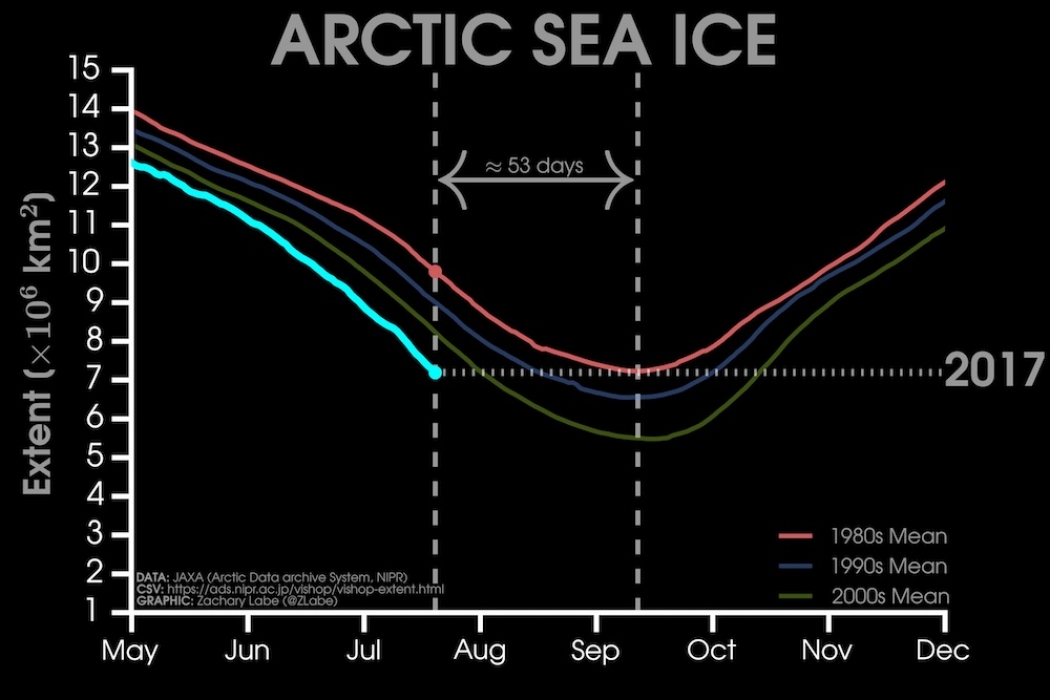
Arctic sea ice has been melting at a steady clip this summer as it heads toward its annual low point. But a new chart shows that with nearly two months still left in the melt season, sea ice area is already below what would have been a yearly low in the 1980s.
The comparison shows the clear long-term decline of Arctic sea ice fueled by the global rise in heat-trapping greenhouse gases. The dramatic shrinkage of sea ice over the past few decades is driving major changes, from the loss of crucial Arctic habitat to the potential influence of weather patterns around the world.
The graph, put together by Zack Labe, a Ph.D. student at the University of California, Irvine, shows the area of the Arctic covered by sea ice right now and compares it to the averages throughout the melt seasons of the 1980s, 1990s, and 2000s. It is clear that with about 50 days of the melt season still to go, sea ice area is already below the point where it would have bottomed out for any year in the 1980s.
“It really shows that we’re in a very different Arctic,” Walt Meier, a sea ice researcher with the National Snow and Ice Data Center, said.
Arctic sea ice reflects incoming solar rays back to space, helping to regulate the planet’s temperature. But as human activities have released more and more greenhouse gases into the atmosphere, the ensuing warming has caused ice to melt. That melt means more of the ocean is open and absorbs solar energy, raising temperatures more and driving more melt in a vicious cycle.
Temperatures in the Arctic are rising at twice the rate of the planet as a whole, and the accompanying ice loss means that walruses and polar bears are losing critical habitat, more of the fragile local ecosystem is being opened up to shipping, and waves from storms can more easily batter coastal settlements. The reduced amount of sea ice may also be causing heat to be released into the atmosphere that is altering wind patterns and weather over the U.S., Europe, and Asia.
Those impacts will only become starker as warming and melt continues in Arctic.
The long-term decline that is evident in the graph can easily be lost in the week-to-week horserace comparisons of sea ice area to recent years, particularly the record low reached in 2012. Labe has noticed that those comparisons have led to false assertions that sea ice is recovering.
Years like 2012, when a storm ushered in exceptional August melt, are actually the outliers. This year and last year, which started the melt season with record lows thanks to winter warmth, are following the steady downward spiral of sea ice.
The chart Labe tweeted is helpful in “reminding people that we’re not going to set a record every year,” but that current sea ice levels are still remarkable, Meier said.
Absent any weather that could drive rapid melt in the coming weeks, this year is unlikely to set a record low when it reaches its minimum in September. But it is still likely to be among the top 10 lowest years, all of which have happened in the past 10 years.
In a few weeks, sea ice area will have dropped below the average annual low of the 1990s, which is noticeably below that of the ’80s. As warming continues, sea ice will reach those milestones earlier and earlier in the year, until the Arctic potentially reaches the point where it is effectively ice free in the summer.


