Last week I noted “El Niño-driven sea surface temperatures are soaring. Forecast: Hot and then even hotter.”
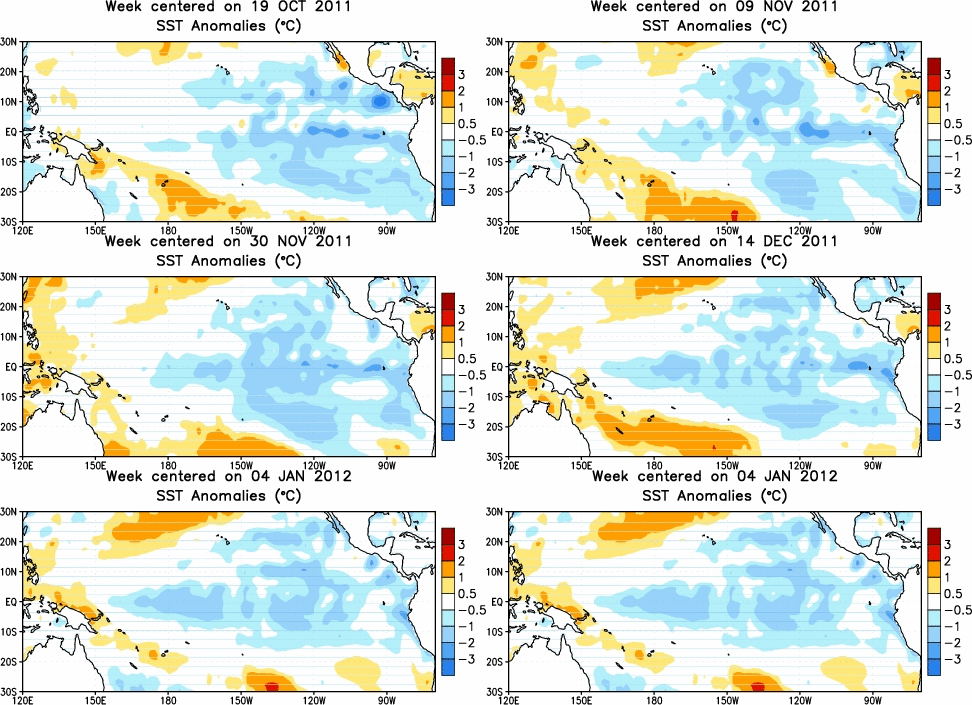
They are still soaring. NOAA’s National Weather Service Climate Prediction Center has a good animation of tropical Pacific SST anomalies:
The warming in the Nino 3.4 region of the Pacific is typically used to define an El Niño — sustained postive sea surface temperature (SST) anomalies of greater than 0.5°C across the central tropical Pacific Ocean.
Two weeks ago the anomaly was 1.1°C. Last week it was 1.5°C. This week it’s 1.7°C, as seen in this figure from NOAA’s latest weekly update on the El Niño/Southern oscillation, “ENSO Cycle: Recent Evolution, Current Status and Predictions“:
If this value is maintained for any length of time, this would be a pretty strong El Niño, as this historical graph of the 3-month running mean SST departures in Nino 3.4 region show:
Technically, we aren’t in a “full-fledged” El Niño episode yet. NOAA says, historically, that requires the the 3-month running mean SST departure to exceed 0.5°C “for a period of at least 5 consecutive overlapping 3-month seasons.” As you can see on page 26 of the weekly report, they can’t make that official until the end of this month.
For the rest of us, it’s increasingly clear that this will be at least a moderate El Niño, and many models are forecasting it will last past the winter and through the spring.
And it bears repeating that back in January, NASA had predicted: “Given our expectation of the next El Niño beginning in 2009 or 2010, it still seems likely that a new global temperature record will be set within the next 1-2 years, despite the moderate negative effect of the reduced solar irradiance.”
It still seems likely. And that will be on top of the hottest decade in recorded history by far.
Related Post:
- Skeptical Science explains how we know global warming is happening: It’s the oceans, stupid!
- Another major study predicts rapid warming over next few years — nearly 0.3°F by 2014
- Must-read AP story: Statisticians reject global cooling; Caldeira — “To talk about global cooling at the end of the hottest decade the planet has experienced in many thousands of years is ridiculous.” Levitt “said he does not believe there is a cooling trend”!!


