This post originally appeared on Energy Self-Reliant States, a resource of the Institute for Local Self-Reliance’s New Rules Project.
Nobel economist Paul Krugman made waves last month when his column “Here Comes the Sun” noted that the rapidly falling cost of solar electricity – “prices adjusted for inflation falling around 7 percent a year” – meant that “solar is now cost-effective.”
It’s close. But it depends on what’s meant by “cost-effective.”
The first step is translating solar prices into electricity prices. Installed costs for solar have dropped dramatically, from $8 to $10 per Watt just a few years ago to as low as $3.50 per Watt for utility-scale systems as just over $4 per Watt for residential systems. But electricity isn’t sold in Watts, but in kilowatt-hours (kWh). So, solar installed at $3.50 per Watt in Minneapolis, MN, will produce electricity for about 23 cents per kWh. In sunny Los Angeles, the same solar PV array would produce power at 19 cents per kWh, because the more abundant and direct sunshine would make 20% more solar electricity over the same time period.
In either place, such prices don’t compare favorably to average residential retail electricity prices of 8 and 12 cents, respectively. In fact, none of the top 40 metropolitan areas in the country have average prices for electricity as high as 19 cents.
But there are several caveats:
- Grid electricity prices are not fixed, but changing. Over the past decade, electricity prices have risen, on average across the United States, 3 percent per year. The solar electricity price is locked in once the panels are operating.
- Some utilities have time-of-use rates that charge more for electricity during peak times (hot, summer afternoons) that rise as high as 30 cents per kWh. Solar competes favorably against these rates.
- There are federal, state and utility incentives for solar that reduce the cost. The 30% federal tax credit, for example, is in statute until the end of 2016.
How much do these issues matter?
Electricity Price Inflation Makes Solar Competitive Now
If electricity price inflation continues apace, by the time their solar PV systems are halfway to their expected life of 25 years, 45 million Americans (roughly 1 in 6) would have cheaper electricity from solar if they installed right now at $3.50 per Watt.
Time-of-Use Pricing Makes Solar Competitive Now
Time-of-use pricing lets utilities charge different prices for electricity at different times of day, based on the actual cost of delivering power at those times. In many places, the higher prices coincide with hot, sunny summer afternoons and effectively increase the cost of electricity by 30% during the time a solar panel produces power. Already 22 million Americans in Southern California can install solar at $3.50 per Watt and beat time-of-use pricing for grid electricity.
Incentives for Solar Accelerate Cost-Effectiveness
Solar power is crossing a cost-effectiveness threshold against grid prices that are rising and reflect the true cost of electricity. But incentives that capture the environmental and economic benefits of solar help finance projects outside of the sunny Southwest.
While only 3 million Americans can beat grid prices with $3.50 per Watt solar and no incentives, 41 million Americans can beat grid prices using the 30% federal tax credit. And the market expansion enabled by tax incentives is driving down the cost to install solar (labor and materials) as well as the cost of modules.
Time Makes Solar a Winner
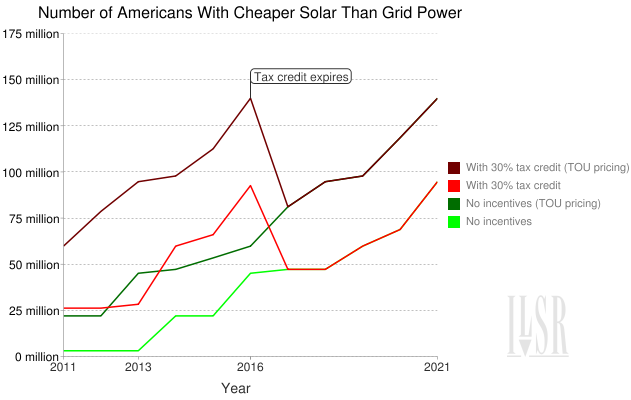
As Krugman notes, the falling costs of solar make time its greatest ally. The following chart illustrates the number of Americans in the top 40 metropolitan areas for whom solar (at $3.50 per Watt in 2011) beats grid electricity prices (average residential retail rates) over the next 10 years. The base assumptions are that the price of solar declines by 7% per year and grid electricity prices rise by 3% per year. The chart examines solar with no incentives and with the 30% tax credit, and with and without utility time-of-use pricing (expected to boost the retail rate during solar producing hours by 30%). The no incentive and tax credit lines merge after the 2016 expiration of the 30% tax credit.

Even without the federal tax incentives or favorable time-of-use pricing, nearly 50 million Americans can beat their utility’s electricity price with solar by 2016. With time-of-use prices, it’s over 90 million by 2016. And with the tax credit factored in, it’s nearly half the country. Of course, the chart will tend to underestimate over time, as the greatest population growth tends to be in the largest metropolitan areas (with the highest electricity prices).
Here comes the sun, indeed.
