The 2010 World Cup is underway! Brazil and Spain may be the favorites, but superstars Kaka and Fernando Torres won’t help their countries score on clean air and low greenhouse-gas emissions as they compete with some of the world’s environmental powerhouses in the bid for the 2010 Green Cup.
To celebrate the World Cup soccer teams whose nations are also champions of the environment, I pitted these countries against each other in the World Cup draw. I ranked the teams based on Yale’s 2010 Environmental Performance Index — instead of soccer skills — to find out which countries advance to the knockout stage and which country ultimately takes home the 2010 Green Cup.
Environmental Performance Index rankings for each nation are indicated in parentheses. A lower number indicates a better ranking.
Group A:
France (7)
Mexico (43)
South Africa (115)
Uruguay (83)
Who moves on: France and Mexico
Analysis: France dominated the group, advancing alongside a decent but unspectacular Mexico side. No chance, really, for the host country South Africa with such a low overall ecosystem vitality score. And an extremely poor biodiversity showing kept Uruguay from advancing.
Group B:
Argentina (70)
Greece (71)
South Korea (94)
Nigeria (153)
Who moves on: Argentina and Greece
Analysis: No real standout coming from Group B. Nigeria, with the lowest environmental rating in the tournament, was never a threat. It was a tight race for the top two spots, but poor air quality did in South Korea. Don’t expect Argentina or Greece to advance past the second round with their low second-tier enviro rankings.
Group C:
Algeria (42)
England (14)
Slovenia (55)
United States (61)
Who moves on: England and Algeria
Analysis: Algeria, surprisingly, moved ahead out of a strong group — top to bottom — and looks to make a statement as the only African club advancing from group play. The U.S. and Slovenia both struggled with high greenhouse-gas emissions and staggering air pollution, which ultimately held them back on the field.
Group D:
Australia (51)
Germany (17)
Ghana (109)
Serbia (29)
Who moves on: Germany and Serbia
Analysis: Germany advanced easily with Serbia. Australia was close behind with a solid showing but fell short because of overabundant greenhouse-gas emissions and bad air quality. Ghana just didn’t show up ready to play this year.
Group E:
Cameroon (133)
Denmark (32)
Japan (20)
Netherlands (47)
Who moves on: Japan and Denmark
Analysis: The soccer favorites in this group (Netherlands and Cameroon) were creamed by the heavy soccer underdogs (Japan and Denmark). Maybe if the Netherlands had the green clout of Scandinavia, it would have made it through a tough round.
Group F:
Italy (18)
New Zealand (15)
Paraguay (60)
Slovakia (13)
Who moves on: Slovakia and New Zealand
Analysis: The battle for the final spot in the knockout stage in this green “Group of Death” is brutally close, but New Zealand edged out reigning World Cup champ Italy. Even the group’s weakest contender, Paraguay, had an admirable showing.
Group G:
Brazil (62)
Ivory Coast (102)
North Korea (147)
Portugal (19)
Who moves on: Portugal and Brazil
Analysis: This was a walkover group for Portugal. And the top-ranked (in soccer) Brazilians only moved on because both Ivory Coast and North Korea (the worst team in the real tournament and second-worst environmentally) are abysmal performers on the environmental fields.

Group H:
Chile (16)
Honduras (118)
Spain (25)
Switzerland (2)
Who moves on: Switzerland and Chile
Analysis: Switzerland dominated its group, but a favorite to win the real World Cup, Spain, wasn’t able to make it through to the knockout round due in part to high CO2 emissions (per electricity generation). You can pin Honduras‘ fatal flaws on poorly defending its forests.
Second Round
A1 vs B2
France (7) vs. Greece (71)
Winner: France
Analysis: Greece had no shot in this match up. It will need to significantly reduce its industrial greenhouse-gas emissions and improve biodiversity if it ever wants to be a contender.
C1 vs. D2
England (14) vs. Serbia (29)
Winner: England
Analysis: Serbia should look to improve its pesticide regulation and biodiversity if it’s expecting to compete at this level.
E1 vs. F2
Japan (20) vs. New Zealand (15)
Winner: New Zealand
Analysis: The first upset of the second round went to New Zealand. Japan‘s solid scores in water quality were nullified by horrid air pollution.
G1 vs. H2
Portugal (19) vs. Chile (16)
Winner: Chile
Analysis: Chile scraped by. Air pollution, once again, took out another quality soccer club (Portugal).
B1 vs. A2
Argentina (70) vs. Mexico (43)
Winner: Mexico
Analysis: Mexico won this battle of lowly ranked green clubs who shouldn’t have made it out of group play. Argentina will need to vastly beef-up its biodiversity and fisheries if it has bigger ambitions.
D1 vs C2
Germany (17) vs. Algeria (42)
Winner: Germany
Analysis: Algeria, Africa’s only hope in the knockout stage, drew a tough opponent in Germany. It could improve its luck next time by improving the air quality, the stress level of its water, and its marine protection.
F1 vs. E2
Slovakia (13) vs. Denmark (32)
Winner: Slovakia
Analysis: Denmark‘s surprising early exit can be chalked up to poor fisheries and CO2 emissions.
H1 vs. G2
Switzerland (2) vs. Brazil (62)
Winner: Switzerland
Analysis: Switzerland soundly destroyed the world’s top soccer club, Brazil. To become a powerhouse in climate as well as sports, Brazil will need significant gains in air quality and reductions in CO2 emissions.
Quarterfinals
- France (7) vs. England (14)
Winner: France
Analysis: England‘s air pollution is worse than Wayne Rooney’s attitude; thus, a stronger French team pulled this one out.
- New Zealand (15) vs. Chile (16)
Winner: New Zealand
Analysis: New Zealand squeaked past Chile. This South American team can come back stronger in 2014 with a reduction in emissions of nitrogen oxides and an improvement to marine protection, important for a country that’s practically all coast.
- Mexico (43) vs. Germany (17)
Winner: Germany
Analysis: Germany ended Mexico’s dream run at the Green Cup. This year’s Cinderella team hit a wall because of poor ecosystem protection, ozone, and a high water stress level.
- Slovakia (13) vs. Switzerland (2)
Winner: Switzerland
Analysis: Once again Switzerland advanced comfortably, defeating a Slovakian team struggling with CO2 emissions.
Semifinals
- France (7) vs. New Zealand (15)
Winner: France
Analysis: New Zealand advanced to the semifinals thanks to terrific forestry and agriculture ratings. But the Pacific island nation struggled with greenhouse-gas emissions per capita.
- Germany (17) vs. Switzerland (2)
Winner: Switzerland
Analysis: Germany made it this far with fantastic biodiversity and forestry, but its struggling fisheries and air pollution dashed all hopes of playing for the Green Cup.
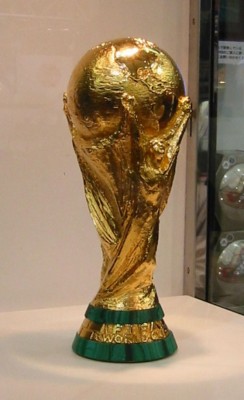 Photo: Wikimedia Commons
Final
Switzerland (2) vs. France (7)
Green Cup winner: Switzerland
Analysis: France made it to the Green Cup final with a fantastic overall environmental health score. However, it should put in extra practice time to cut back on air pollution if it’s ever going to reach the top. Switzerland rode its world-class overall environmental health score and stellar overall ecosystem vitality score to the top of the Green Cup world. To stay there it’ll need to boost air quality and lower their greenhouse gas emissions per capita to stay competitive with countries looking to pass them up four years from now.


