Energy Self-Reliant States [PDF], a flawed study on local Renewable Energy availability from the Institute for Local Self-Reliance (ISLR) found that 18 of the 50 states could not meet their electricity needs with local renewables. In fact, no state can meet its electricity demand through local renewables without expensive electricity storage. On a national basis, such storage would cost an estimated $13 trillion, or over 65 times the cost of the transmission investments they oppose.
One of the study authors, John Farrell, has been promoting the study as a “Heresy on Transmission.” Rather than a heretic attacking misguided establishment shibboleths, this flawed study attacks a simplistic misunderstanding of why we need transmission. Farrell and his co-author David Morris are either intentionally promoting this misunderstanding, or they simply fail to grasp the reasons behind long distance transmission’s necessity.
Their straw man is the false choice between states relying on local renewables such as PV on rooftops which supposedly would require only “minimal transmission upgrades” and far-off wind farms requiring expensive long distance transmission. They say, for example,
[I]f Ohio’s electricity came from North Dakota wind farms — 1,000 miles away — the cost of constructing new transmission lines to carry all that power and the electricity losses during transmission could result in an electricity cost to the consumer that is about the same, or higher, than local generation with minimal transmission upgrades.
This ignores most of the benefits which would flow from new transmission lines connecting North Dakota and Ohio. A 1,150 mile transmission line from Bismark to Cincinnati would also connect Fargo, Minneapolis, Eau Claire, Madison, Chicago, and Indianapolis running along Interstate Highway corridors (Google maps.) It also ignores the study’s own finding that Ohio would only be able to generate 29 percent of the electricity it needs with local renewables.
Incidentally, their national map shows Ohio being able to generate 33 percent of its electricity from local renewables, but adding up their own numbers for the renewables they identify gives 29 percent. I looked closely at their numbers for only six states, so there may be other arithmetic errors as well.
The states along this hypothetical route are North Dakota, Minnesota, Wisconsin, Illinois, Indiana, and Ohio. The study found that these states can generate the following percentages of local demand with in-state renewables:
| State | %Wind | % Solar | % Small hydro | % CHP | Total |
| North Dakota | 14,000% | 19% | 1% | 4% | 14,024% |
| Minnesota | 1,311% | 24% | 1% | 4% | 1,340% |
| Wisconsin | 120% | 22% | 1% | 5% | 150% |
| Illinois | 57% | 17% | 2% | 4% | 80% |
| Indiana | 83% | 18% | 1% | 3.6% | 106% |
| Ohio | 3% | 20% | 1% | 5% | 29% |
If each of these states attempted to meet their local electricity needs with the renewables in the study, Ohio and Indiana would still need to import some electricity from other states. Although Ohio would not need to import power from as far away as North Dakota, they would have to tap into Minnesota’s wind resources if demand were to be satisfied along this corridor. An attempt to meet that demand with the nearest resources might look like this:
| State | %Wind | % Solar | % Small hydro | % CHP | Total |
| North Dakota | 300% | 2% | – | 2% | 304% |
| Minnesota | 150% | 10% | 1% | 2% | 163% |
| Wisconsin | 120% | 22% | 1% | 5% | 148% |
| Illinois | 57% | 17% | 2% | 4% | 80% |
| Indiana | 83% | 18% | 1% | 3% | 105% |
| Ohio | 3% | 20% | 1% | 5% | 29% |
You’ll note that the total above exceeds 600 percent because the states with renewable energy surpluses have much lower local demand. The magnitudes of this demand are my best guess. Keep in mind that I did not choose this corridor to make my example work; the suggestion came directly from the transmission example in the study.
The Consequences of Timing
By the study’s own methodology, both Ohio and Illinois need interstate transmission, because they cannot generate all their renewable electricity locally. Yet, as I will demonstrate, even though North Dakota and Minnesota would be generating electricity for export, they will often need to import renewable electricity as well.
Using the Correlation Maximization tool on Energy Timing (note: Energy Timing has been taken down, see comment here.), I generated the best portfolio of North Dakota wind and solar farms to meet the needs of Square Butte Electric Coop, an electric utility in Grand Forks, N.D. The results are shown below:
Composition of Optimal Portfolio of North Dakota Renewable Energy:

| Site Name | Type | Optimal Weight | Capacity Factor | |
| 1) | Olga 5, ND | Wind | 63% | 21% |
| 2) | Pickert, ND | Wind | 19% | 38% |
| 3) | Valley City, ND | Wind | 18% | 22% |


This combination of three wind farms represents the best fit between electric output from existing wind farms and solar sites in Energy Timing’s database, and local demand. Even though this is the best fit, the correlation between supply and demand is only 13.2 percent. Solar sites do not appear in the optimal portfolio because they do not lead to a better fit.
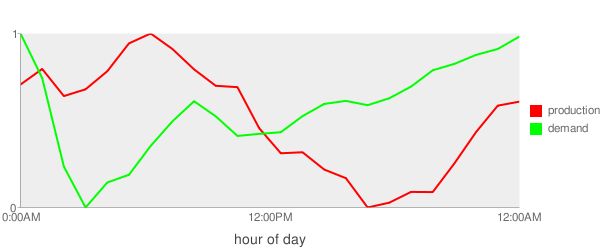
As you can see from the bottom graph, wind output is strongest in the morning, when demand is relatively low, and falls off in the afternoon, as demand rises. Hence, unless North Dakota builds far more wind farms than it needs to supply local demand (an expensive proposition which could only be justified by electricity exports), they would not have enough electrify in the afternoon and early evening, when the wind typically dies down. This would be the situation on a typical day. On any given day, wind power is even more variable than it is on average, leading to large and frequent swings from oversupply to undersupply.
In the case of Minnesota electrical demand, solar sites turn out to be a better fit than wind sites. In reality, if Minnesota were to attempt to meet local demand with renewable energy, a mix of wind and solar sites would be used, since wind is so much less expensive than solar. But since solar sites are the best fit for local demand, a mix of wind and solar would produce a worse match than the 24.5 percent correlation we see in the scenario above.
Benefits of Transmission
We can now see how both Minnesota and North Dakota would benefit with a high capacity transmission connection between the states. In the early morning, before the sun rises, Minnesota will not be producing any domestic renewables, so it makes sense to import electricity from North Dakota, where production is far in excess of demand all morning. Minnesota will in turn be able to supply excess solar power to North Dakota in the afternoon before the sun gets low and cuts solar output.
In short, even though both Minnesota and North Dakota can easily produce enough local renewable electricity for their needs, the timing of that electricity causes problems of both oversupply and unmet demand. If we build transmission connecting states regions, these problems are reduced, and less storage is needed to make up the difference.
As we increase the interregional connections, we will be able to bring in power from farther afield that better meets demand. For instance, both these states don’t have enough local renewables in the evening, even when combined. The worst period is just around dusk, from about 5 p.m. to 8 p.m. CST, before the wind begins to pick up at night in North Dakota. But in the sunny Mojave Desert of southern California, the sun is still up (it’s two hours earlier, Pacific Time), and large Concentrating Solar Power (CSP) plants can use relatively cheap thermal storage to continue producing power for hours after sunset.
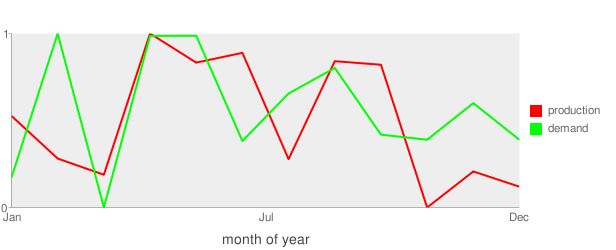
We can also see that both North Dakota and Minnesota typically have spare production capacity in the summer months, so they could export electricity back to the Southwest during these months, when Southwest electricity demand peaks due to air conditioning loads.
As we increase the length of regional transmission networks, each state along the path gains, both as an electricity exporter and as an importer depending on the season and weather conditions. Ohio does not need to pay for giant transmission lines from North Dakota to import which “could result in an electricity cost to the consumer that is about the same, or higher, than local generation.” North Dakota, Minnesota, Wisconsin, Illinois, and Indiana would also benefit from such a line, and all could be asked to contribute.
Costing Storage vs. Transmission
The study’s authors also invoke electricity storage to “solve” the problem of timing, saying
Some renewable fuels, like sunlight and wind, are variable. Thus, the estimates, especially for wind, assume a significant level of storage or on-demand distributed generation.
Unfortunately, they make no attempt to account for the price tag of such storage. They state only,
This report does not examine storage and its implications, but in our analysis of variable renewable energy potential, we assume that sufficient storage is available.
“On-demand distributed generation” could come from natural gas or biomass. Renewable generation relies on the availability of the natural resource, few of which can be stored. Even incremental hydropower is typically not on-demand, because it is usually the result of adding generation to existing dams and comes with obligations to maintain flow rates.
Biomass based power is typically baseload, not on-demand. Furthermore, the study authors explicitly rule out the large scale use of biomass for electricity because they expect the amount of biomass-based electricity to be “modest.” Even if large scale, on-demand distributed biomass based generation were available, it would only be available in those states with a large biomass resources. See the map below.

Natural gas is an incomplete response to climate change in that it is a fossil fuel, may not even be available in the necessary quantities, and must be imported by the vast majority of states. What is the point in pushing for reliance on locally generated renewable electricity if it only increases our dependence on imported natural gas which may not be available and produces greenhouse gas emissions?
Given the not only daily, but seasonal mismatches between local electricity production and demand, states which are locally self-sufficient in electricity would have to invest in a month or more worth of storage. While electric vehicles may be able to provide some daily or hourly storage, they will not be available for seasonal electricity storage, since the vehicle owners will need to drive them, and so cannot keep them fully charged for months or even days on end.
The cheapest large scale electricity storage solutions, (Pumped Hydropower, Compressed Air Energy Storage, and Molten Salt Thermal Storage) typically cost $10 to $50 per kWh of storage. Unfortunately, all three of these options are limited in where they can be located, so restricting transmission will also restrict the use of these cheaper forms of storage. The cheapest battery and flow battery storage technologies cost about $100 to $150 per kWh. To be generous, I will assume that all states can build as much electricity storage as they want at $50 per kWh, or $50,000 per MWh. I will also assume that geothermal, hydropower, combined heat and power, and efficiency gains will mean that solar and wind will need to supply only 50 percent of our current electricity usage.
According to the Energy Information Administration, total electricity production in 2007 was 4,156,745 thousand MWh. An average monthly production was thus 346,395,000 MWh, and the cost of a month’s worth of national electricity storage to meet half of a month’s demand would be $8,665 billion under the assumptions above. In contrast, the ILSR study states that “FERC, Congress, and environmental groups … rush to accelerate the construction of a new $100-$200 billion interregional transmission network.”
If such a network cost $200 billion, and reduced the need for storage by only 10 percent, then it would have paid for itself more than eight times. Given less conservative (and I think more realistic) assumptions of reducing the need for storage by 50 percent, and a per MWh cost of storage of $75,000, a regional transmission network would pay for itself in reduced storage needs by 65 to 1.
Conclusion
To me, 65-to-one, or a savings of approximately $13 trillion, seems worth the price of stringing wires. For comparison, $700 billion has been spent on the war in Iraq since 2001. In other words, the ILSR study is suggesting that we pay for eighteen wars in Iraq in order to avoid building an interregional transmission network, costing about as much as we spent in Iraq in 2008.
In fact, the price for local self-reliance on renewable energy would likely be higher. Thirteen trillion dollars does not include the cost savings that the report’s authors tried to address: Transmission allows us to exploit less expensive renewable generation. Furthermore, the variability of both wind and solar generation can be vastly reduced by combining the output of dispersed wind and solar farms. Less variability reduced the need for costly spinning reserves to stabilize the grid if wind power suddenly drops or a cloud passes above a solar farm.
Not all self-styled heretics are fighting a just cause against an oppressive consensus. To the extent that a consensus exists in favor of an improved national transmission grid, it is based on sound science and economics. It is unfortunate that so many environmentalists are seduced by the mirage of renewable energy self-reliance.


